Moomoo Desktop: Trading Platform User Experience Analysis and Optimisation
The global liquidity from interest rate cuts, broader financial literacy, lower investment thresholds, and the pandemic have fuelled a surge in individual investors. In China, new stock accounts increased 25 million in 2024, up 16.6% from 2023 (Eastmoney, 2025). In the US, 62% of American adults directly or indirectly hold stocks, a notable increase from 55% in 2019 (Gallup, 2025). Designing a high-quality user experience tailored for this growing group becomes worthy to explore.
As one of the investment platform for trading stocks, options, forex, cryptocurrencies, and wealth management products across global markets (SG, US, HK, CN, JP), moomoo launched its desktop version in September 2024. This article targets its desktop version, reconstructed user personas, mapped the user journey of "Watchlist" interface through communications with individual investors, and proposes potential experience issues, opportunities, and optimisation directions for moomoo.
Year
2025
Duration
2 Weeks
My Contribution
Defining Core Persona
User Research
User Journey Mapping
Competitive Analysis
Rapid Prototyping
Persona Generation
Deriving User Personas
After choosing moomoo as the target, I learned Futu’s vision of creating a seamless investment experience for individual investors (Yimie, 2024), supported by matured research and design groups. Building on these foundations, I started my research from past year's moomoo market reports and combined them with research literature on individual investors from the past five years to derive the product’s user personas.
Globalisation

Users may come from the United States, Canada, Japan, Australia, Singapore, Malaysia, Hong Kong, and mainland China, with a global perspective(moomoo.com)。
Pursuing Investment Returns

Users are motivated to improve their financial status, take fees and offers in consideration while choosing an investment platform(Moomoo Malaysia, 2024; Brokcer Chooser, 2025; Comments on Reddit)。
Tech-Savvy Millennials and Gen Z

Millennials (aged 28–43) represent the largest investor group, while Gen Z engages with investment knowledge earlier (World Economic Forum, 2025). Both of them grow up with technologies, and adapt to new technologies fast.
Limited Investment Knowledge

In financial literacy assessments, only 42% of Gen Z and 32% of Millennials pass personal finance tests (TIAA Institute-GFLEC Personal Finance Index, 2024)
Generating User Personas
Based on the user characteristics of moomoo identified through desk research, along with key variables of investor segments—such as asset allocation, risk appetite, and investment goals—I used AI to generate three user personas.
Generating User Personas
Based on the user characteristics of moomoo identified through desk research, along with key variables of investor segments—such as asset allocation, risk appetite, and investment goals—I used AI to generate three user personas.
Generating User Personas
Based on the user characteristics of moomoo identified through desk research, along with key variables of investor segments—such as asset allocation, risk appetite, and investment goals—I used AI to generate three user personas.
Hover on images to explore
Tap images to explore
Tap images to explore


Identify The Core User
Using user scale and value as the horizontal and vertical axes, the three user personas were positioned on a user map. Among them, individual investors like Alex Chen—who aim for financial freedom—were identified as the core users of the product due to their relatively frequent trading activities and a continuously growing user base(World Economic Forum, 2025).
Value*
Professional investors focusing on global markets
Individual investors for stable returns
Individual investors for financial independence
Scale
*Value is estimated based on asset volume, trading frequency, and the likelihood of using potential premium services.


I'm trading for financial freedom—still learning.
Alex Chen
28/🇸🇬/Software Engineer
Investment Profile
Experience: Intermediate
Markets: U.S. and Singapore (stocks and options)
Risk Appetite: Medium to high
Financial Status: Moderate savings, invests part of monthly income
Trading Frequency: Trades several times a week, aiming to make trading a primary income source
Behavioural Traits
Spends 1–2 hours daily researching market trends and analysing stocks using data and charting tools.
Experiments with simple options strategies but feels hesitant about more complex ones.
Frequently browses other traders' insights, keeps a personal trading log.
Adjusts portfolio in spare time, favouring tech stocks and high-volatility stocks with strong return potential.
Pain Points & Goals
Lacks confidence in mastering complex strategies and hasn’t yet developed a systematic approach—relies on educational tools and community insights to improve skills.
Wants to develop high-probability strategies and see clearly how to set up complex trades; expects faster execution speed and stable real-time data.

I'm trading for financial freedom—still learning.
Alex Chen
28/🇸🇬/Software Engineer
View More
Drilling Down
The Investment Journey
As the core user, 28-year-old software engineer Alex Chen trades stocks through moomoo NX with the goal of financial freedom. He keeps up with market news via investment communities and continuously refines his strategies by learning.
I summarised his investment journey by three stages—decision-making, trading, and portfolio management—and chose to focus on the decision-making phase for further analysis, considering both the functional relevance and feasibility for follow-up research. This phase offers key insights into user pain points and opportunities.
Decision ⭐️
Gather market news
Adjust and monitor watchlist
Review stock charts and indicators
Research the company
Trading
Search for target stocks
Set up an order
Trade execution/cancellation
Review trading history
Portfolio Management
Check current holdings
Conditional order set up
Portfolio adjustment
User Interview
Interview Facilitation
Following the tasks Alex might do under the decision-making phase, I designed design interview questions. Then, based on the core user I defined, there were 5 participants recruited. In the interview sessions, I asked them about their stock trading experiences and invited them to try out moomoo desktop.

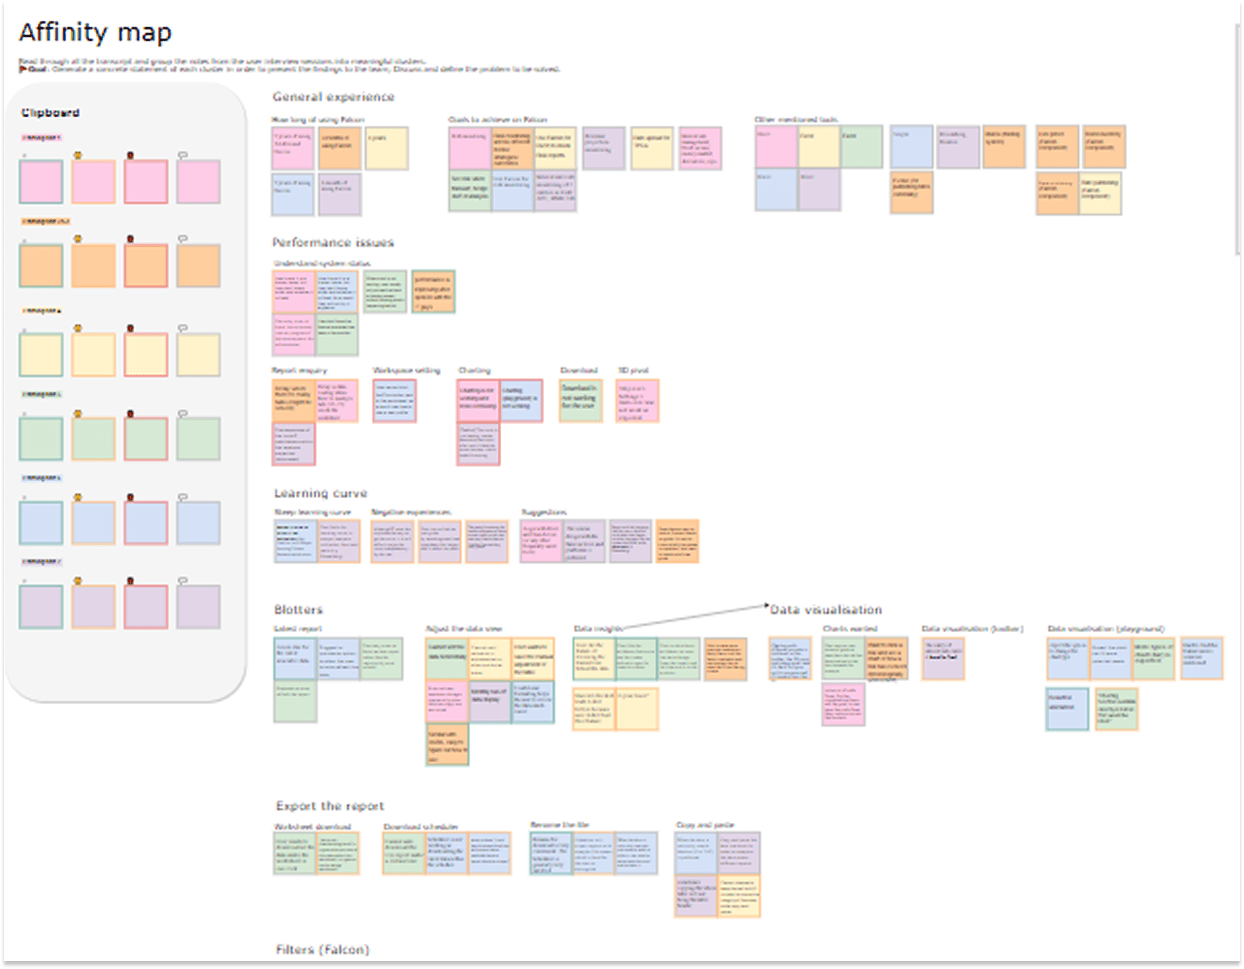
User Journey Map
After talking with those actual investors, I identified several common issues they encountered while using moomoo desktop version and trading, along with some interesting insights beyond the main trading flow.
User Journey Map
After talking with those actual investors, I identified several common issues they encountered while using moomoo desktop version and trading, along with some interesting insights beyond the main trading flow.
User Journey Map
After talking with those actual investors, I identified several common issues they encountered while using moomoo desktop version and trading, along with some interesting insights beyond the main trading flow.
Stage
Stock Screening
Individual Stock Analysis
Trade
Action
Enter "Watchlist"
Screening Watchlist
Review Saved Items
Search New Items
Observe Trend
Adjust Stock View
Form Trading Strategy
Thou-ghts
Let’s see how the stock market is doing today.
There're too many stocks to keep track—let’s check out some of the trending themes instead.
Can’t view the charts in the list right away, and the info is limited—guess I’ll have to click through one by one.
There's the pro in the community just mentioned some stocks —better check its trend and add it to the watchlist if it looks promising.
Check the candlestick chart and moving averages... but where’s the moving average? Where can I set it up?
I spent a while searching for the MACD settings, but it’s nice to be able to view multiple indicators at once.
The next trade...
Feeling
Pain
Points
Oppor-
tuni-
ties
The page is information-heavy, with a particular stock taking up most of the space, though it may not be the one Alex wants to see.
Alex follows many stocks, but lacks effective tracking, causing him to miss profitable opportunities.
Alex wants to quickly identify valuable stocks through watchlist, but the data the table provided is limited.
Some veteran investors in community share lists of stocks, but entering the codes one by one to follow them is a bit tedious.
Moving Averages are seen as essential indicators, but when starting out, Alex couldn't find the option to display them in the chart settings.
Alex also wanted to find settings for MACD and KDJ in the chart options or around the sub-chart area, but couldn't.
Quick Trade modal blocked stock information, and the absence of commission fee display unintentionally increase Alex's position.
Allow Alex to access a more comprehensive watchlist when entering the watchlist page.
Improve the watchlist feature to help Alex focus on the data that matters to him and quickly identify stocks worth monitoring, enabling continuous and effective tracking.
Enable Alex to bulk add stocks to his watchlist and group them during the process.
Provide a guide or add an entry point for moving average settings within the chart options.
Provide a guide, add an entry point for Moving Average settings in the chart options, or allow indicator setup in the sub-chart area.
Help Alex understand trading commissions so he can make more informed buy and sell decisions.
Socialisation of investing
All interview participants joined at least one investment community, including WeChat Group, DingTalk, Niuniu Circle, and stock comment sections. Investors with limited technical analysis knowledge generally rely on recommendations from others.
Jargon Barrier
Even investors with more than a decade of experience often find themselves confused by the variety of terms in analysis. A little guidance could go a long way in helping them build confidence and independent thinking.
Challenges in Tracking Stock Trends
Although the watchlist is the first screen investors see when opening the trading platform, it has not proven effective in helping those interviewed keep track of their stocks.
Less Is More
Although new stocks emerge with every market wave, 3 out of 5 investors tend to focus on a few they already know. This may stem from a lack of understanding, confidence, or failure to monitor and act at the right time.
Converge
Narrowing Down The Scope
Through user interviews, I identified core challenges across different stages of the user journey:
Stock Discovery – How can users effectively track the stocks they’re interested in?
Stock Analysis – How can users get started more easily on the desktop trading platform?
Trade Decision-Making – How can we support users in making informed trades?
Given the age skew of interviewees (most being more aged and potentially less tech-savvy) and the limited number of participants with active moomoo trading accounts, I’ve chosen to focus on optimizing the stock selection phase, where the goal is to help users effectively track stocks they care about. This will serve as the foundation for exploring design improvements.
Problem Defination
Based on the analysis of similar features in other platforms and insights from user interviews, the obstacles users face can be attributed to two key causes:
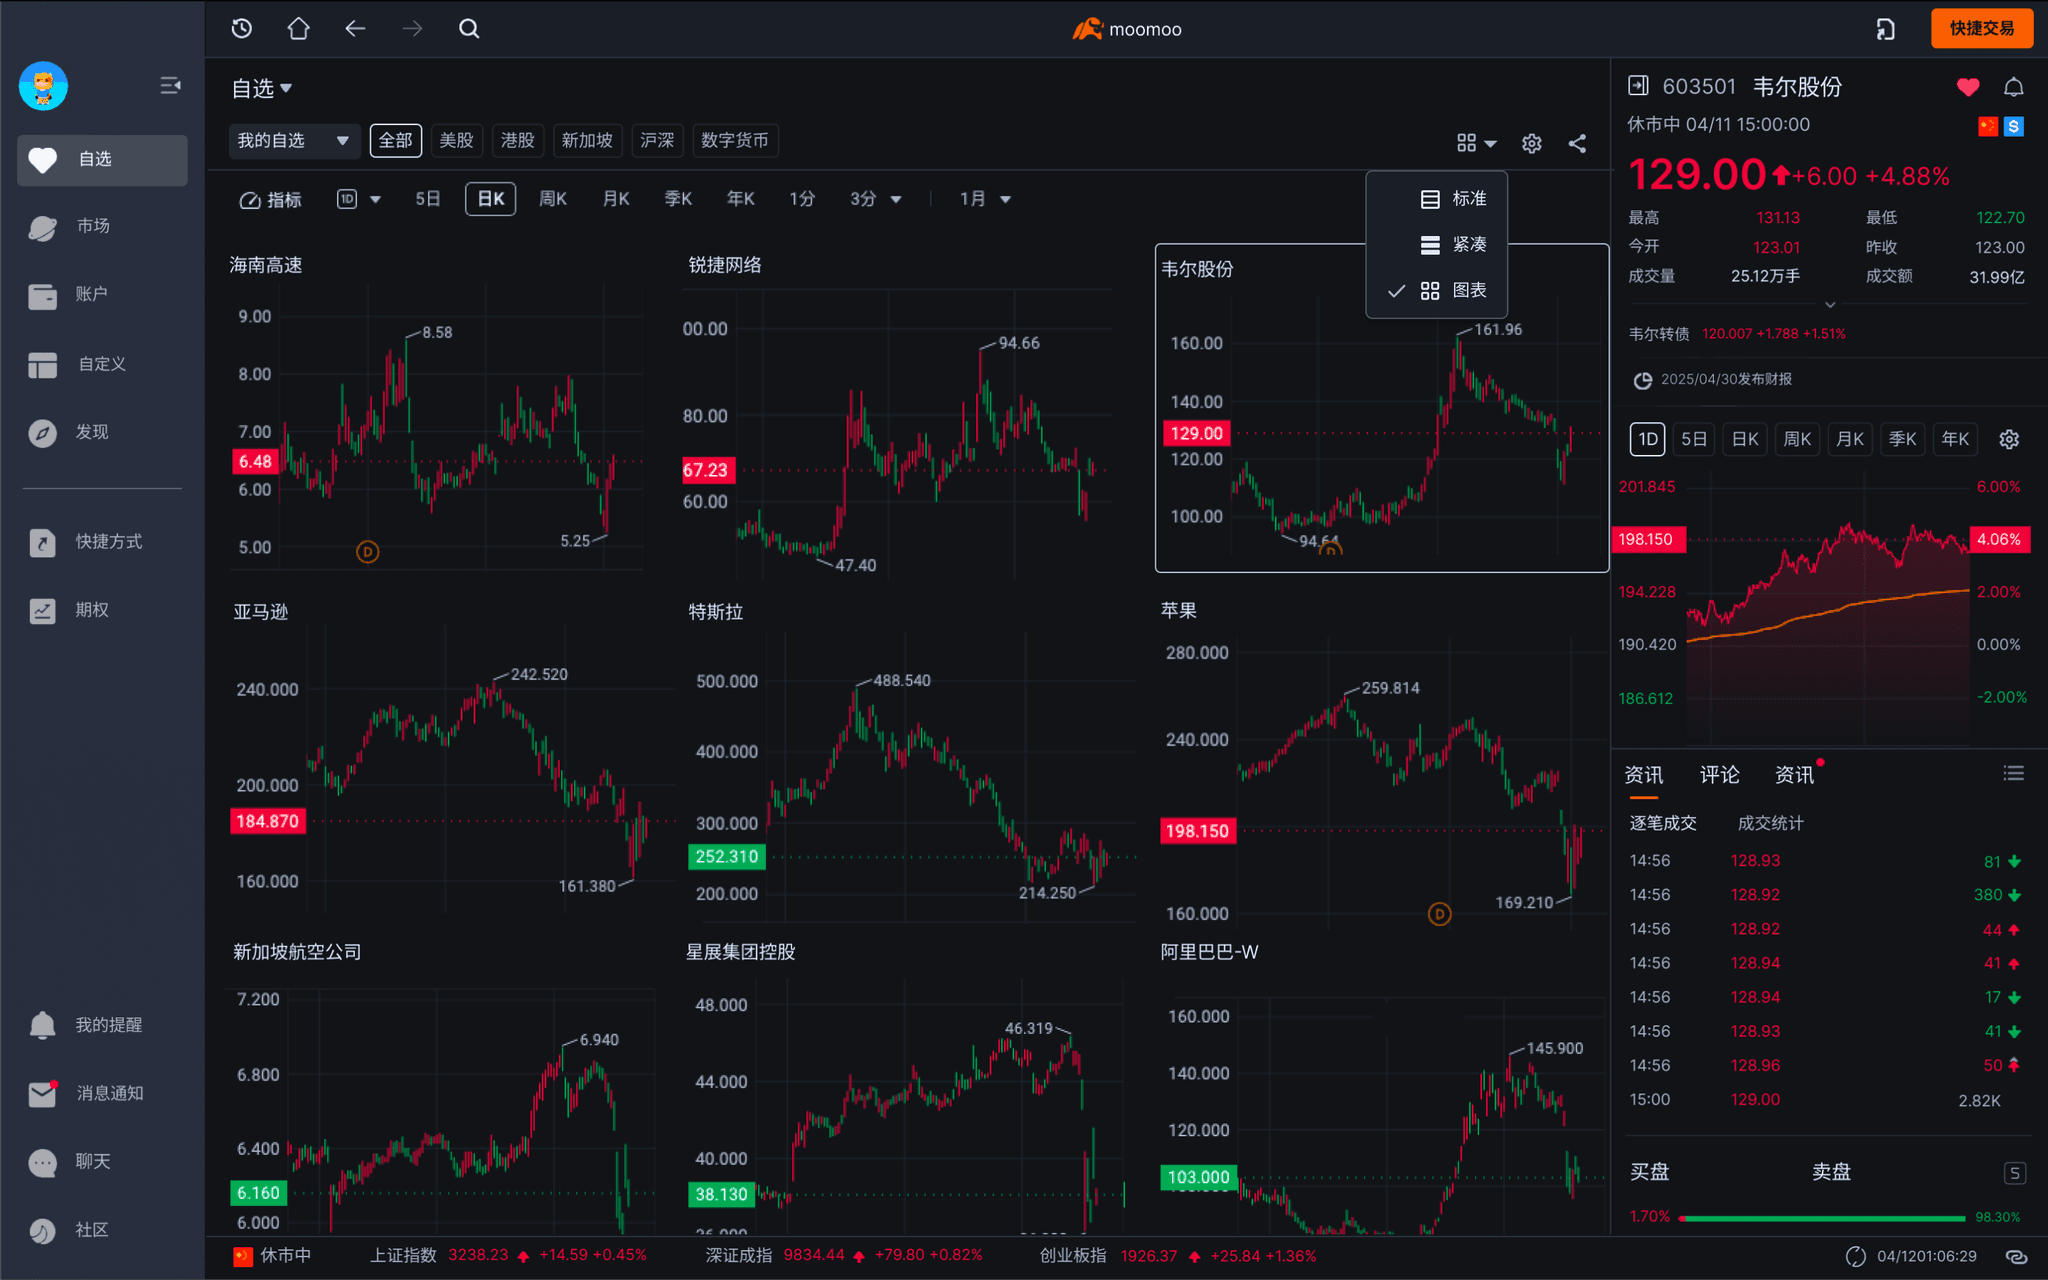
Visual Clutter:
The side-by-side layout of the watchlist and individual stock charts on the “Watchlist” page creates overloaded visual density, reducing the space available for the stock list itself.Lack of Visual Hierarchy and Personalisation:
The current watchlist view lacks clear visual guidance and customisation options, making it difficult for users to quickly identify stocks of interest.
Problem Defination
Based on the analysis of similar features in other platforms and insights from user interviews, the obstacles users face can be attributed to two key causes:
Visual Clutter:
The side-by-side layout of the watchlist and individual stock charts on the “Watchlist” page creates overloaded visual density, reducing the space available for the stock list itself.Lack of Visual Hierarchy and Personalisation:
The current watchlist view lacks clear visual guidance and customisation options, making it difficult for users to quickly identify stocks of interest.
Pain Point 1
Alex wants to quickly spot stocks worth watching from the watchlist, but struggles to find what really matters in the table view.
Pain Point 2
Alex follows many stocks, and some rose quickly after being added to the watchlist — but without an effective way to track them, valuable opportunities were missed.
Pain Point 3
The page is information-heavy, and one stock’s chart takes up most of the space — but it’s often not the one Alex is interested in.

Competitive Analysis
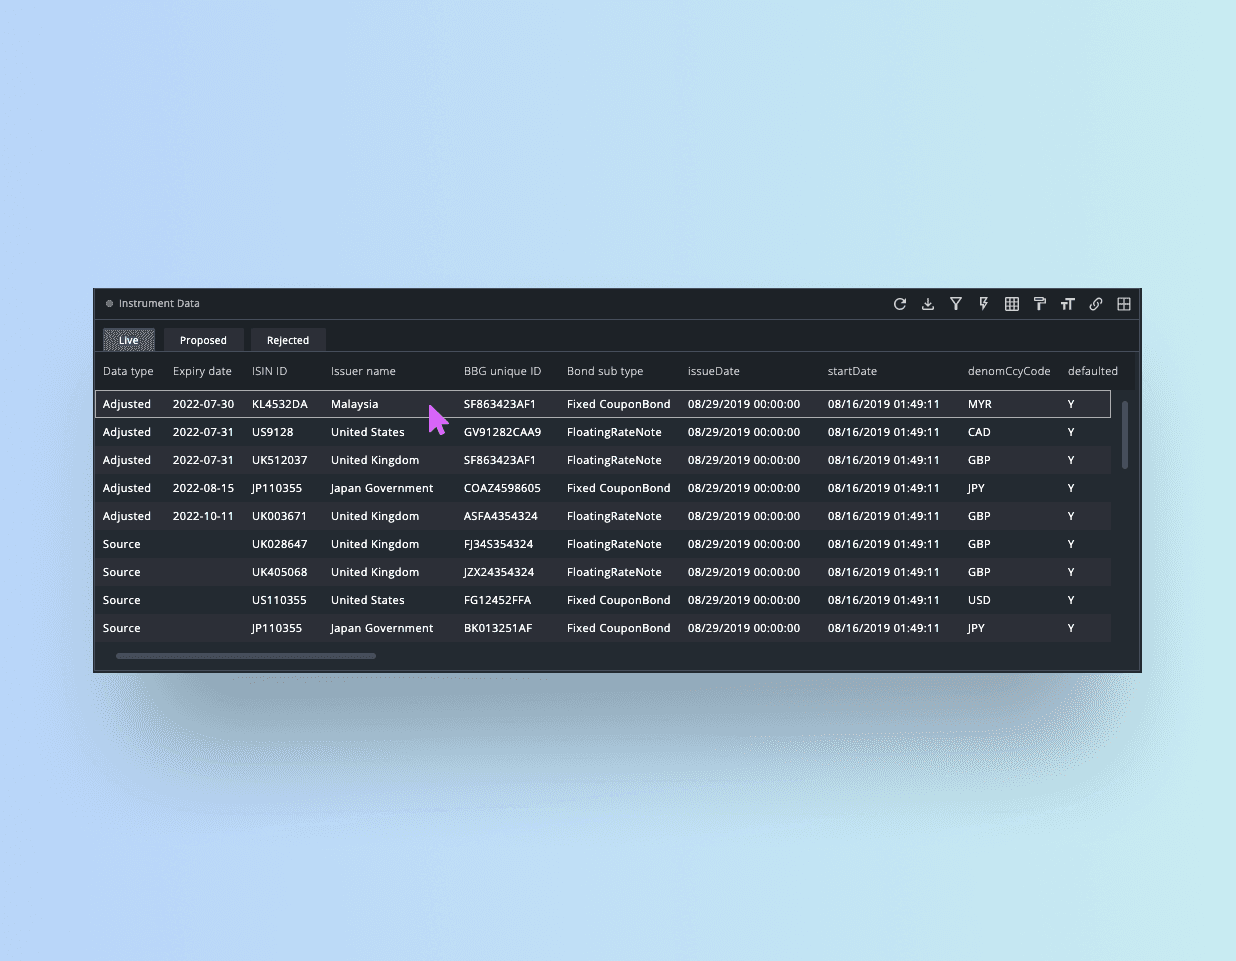
To better understand how current market solutions address the identified pain points, I analyzed and tested products mentioned during the interviews. Key observations were documented.
To ensure that future design directions align with existing user habits, I also explored both the mobile and desktop versions of moomoo.
Competitive Analysis
To better understand how current market solutions address the identified pain points, I analyzed and tested products mentioned during the interviews. Key observations were documented.
To ensure that future design directions align with existing user habits, I also explored both the mobile and desktop versions of moomoo.


While checking out different platforms, I found that some desktop platforms and all mobile platforms separate the watchlist and individual stock charts into different pages to reduce cognitive load.
This raised the question: could a similar information architecture be applied to moomoo’s desktop platform?
However, during my use of moomoo, I noticed that when users click into stock details from filtered lists under different tabs, the platform doesn’t force a tab switch — enabling a smoother, more linear experience.
Considering the cost of major changes, I chose to design within moomoo’s existing desktop interaction model.


Meanwhile, I explored how interviewees typically select stocks and the reasoning behind their choices. I also examined how other platforms design their watchlist. Based on these insights, I proposed a redesigned watchlist interface later on.
Improvement Strategy & Proposed Solutions
Focusing User Attention by Splitting the Watchlist Page
By separating the stock filtering process from the stock analysis flow, we reduce information overload and lower cognitive load, allowing users to focus on the critical steps of selection or decision-making without disrupting moomoo's existing interaction model.
This redesign frees up space for the watchlist and unlock its potential, providing users with more flexibility in adjusting the table view. As a result, the watchlist will better support stock tracking and investment decisions.
NOW
The watchlist, single stock trends, and fundamentals on a single page leads to distractions

THEN
Split the original interface into two parts, focusing separately on stock selection and analysis.
Double Click
Double Click


Redesigning the Watchlist
By splitting the original interface into separate pages for the watchlist and single stock details, the watchlist now has more space to unlock its full potential in helping users track market trends.
Based on the issues identified in the user journey, I proposed improvements across several dimensions: data filtering and grouping, single stock enquiry, a quick overview, and investment social features.
1
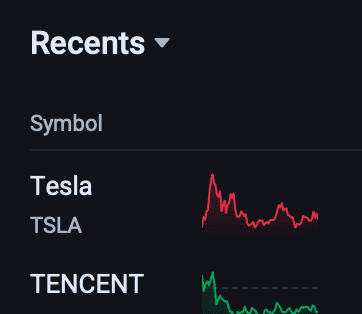
Recently-Added Stock Filtering
DATA FILTERING AND GROUPING
For short-term traders, newly added stocks are often time-sensitive. To make it easier to revisit them, I added a “Watchlist” tab under the existing “Recently Viewed” section in moomoo.
NOW
THEN

2
Add an “All” Option
DATA FILTERING AND GROUPING
In testing, I found that none of the users intuitively understood that clicking a selected market would deselect it. To address this, I introduced an explicit “All” option, making it easier for users to reset their selection without guesswork.
NOW

THEN

3
Stock Notes: Stay on Track
SINGLE STOCK ENQUIRY
Traders often observe market conditions throughout the day (e.g., breakouts, end-of-day) before making a decision. Quick notes help users track and reduce errors. Using natural language processing can make the interaction more intuitive.


moomoo
Tesla: Sell if pullback
3:30
4
Provide Diverse Data and Customisable Data Combinations
SINGLE STOCK ENQUIRY
Users evaluate individual stocks from various dimensions. With more space in watchlist page, users can build their personalised data combinations.
Market Cap
Consecutive Up Days
MTD Chg

5
Flexible Candlestick Chart Viewing
QUICK OVERVIEW
The human brain processes visual patterns faster than numerical analysis, making candlestick charts key for quickly grasping trends. In the watchlist, allowing users to select timeframes (e.g., monthly, weekly) while viewing price charts helps investors spot trends faster. The candlestick chart in the stock info panel further enhances efficiency by enabling quick comparisons across timeframes.

6
Chart View (Adopting Mobile Functionality)
QUICK OVERVIEW
Similarly, leveraging the larger screen on the desktop, the icon view helps users quickly grasp the market trends of their watched stocks.
7
One-Click Import of Stock Picks
INVESTMENT SOCIAL
With the rise of investment socializing, stock recommendations play a key role. Instead of manually entering stock codes from curated lists, a one-click import would save time, allowing users to focus on research and analysis.

1
Recently-Added Stock Filtering
DATA FILTERING AND GROUPING
For short-term traders, newly added stocks are often time-sensitive. To make it easier to revisit them, I added a “Watchlist” tab under the existing “Recently Viewed” section in moomoo.
NOW
THEN
2
Add an “All” Option
DATA FILTERING AND GROUPING
In testing, I found that none of the users intuitively understood that clicking a selected market would deselect it. To address this, I introduced an explicit “All” option, making it easier for users to reset their selection without guesswork.
NOW
THEN
3
Stock Notes: Stay on Track
SINGLE STOCK ENQUIRY
Traders often observe market conditions throughout the day (e.g., breakouts, end-of-day) before making a decision. Quick notes help users track and reduce errors. Using natural language processing can make the interaction more intuitive.
moomoo
Tesla: Sell if pullback
3:30
4
Provide Diverse Data and Customisable Data Combinations
SINGLE STOCK ENQUIRY
Users evaluate individual stocks from various dimensions. With more space in watchlist page, users can build their personalised data combinations.
Market Cap
Consecutive Up Days
MTD Chg
5
Flexible Candlestick Chart Viewing
QUICK OVERVIEW
The human brain processes visual patterns faster than numerical analysis, making candlestick charts key for quickly grasping trends. In the watchlist, allowing users to select timeframes (e.g., monthly, weekly) while viewing price charts helps investors spot trends faster. The candlestick chart in the stock info panel further enhances efficiency by enabling quick comparisons across timeframes.
6
Chart View (Adopting Mobile Functionality)
QUICK OVERVIEW
Similarly, leveraging the larger screen on the desktop, the icon view helps users quickly grasp the market trends of their watched stocks.
7
One-Click Import of Stock Picks
INVESTMENT SOCIAL
With the rise of investment socializing, stock recommendations play a key role. Instead of manually entering stock codes from curated lists, a one-click import would save time, allowing users to focus on research and analysis.
Recently-Added Stock Filtering
DATA FILTERING AND GROUPING
For short-term traders, newly added stocks are often time-sensitive. To make it easier to revisit them, I added a “Watchlist” tab under the existing “Recently Viewed” section in moomoo.
NOW
THEN
Add an “All” Option
DATA FILTERING AND GROUPING
In testing, I found that none of the users intuitively understood that clicking a selected market would deselect it. To address this, I introduced an explicit “All” option, making it easier for users to reset their selection without guesswork.
NOW
THEN
Stock Notes: Stay on Track
SINGLE STOCK ENQUIRY
Traders often observe market conditions throughout the day (e.g., breakouts, end-of-day) before making a decision. Quick notes help users track and reduce errors. Using natural language processing can make the interaction more intuitive.
moomoo
Tesla: Sell if pullback
3:30
Provide Diverse Data and Customisable Data Combinations
SINGLE STOCK ENQUIRY
Users evaluate individual stocks from various dimensions. With more space in watchlist page, users can build their personalised data combinations.

Market Cap
Consecutive Up Days
MTD Chg
Flexible Candlestick Chart Viewing
QUICK OVERVIEW
The human brain processes visual patterns faster than numerical analysis, making candlestick charts key for quickly grasping trends. In the watchlist, allowing users to select timeframes (e.g., monthly, weekly) while viewing price charts helps investors spot trends faster. The candlestick chart in the stock info panel further enhances efficiency by enabling quick comparisons across timeframes.
Chart View (Adopting Mobile Functionality)
QUICK OVERVIEW
Similarly, leveraging the larger screen on the desktop, the icon view helps users quickly grasp the market trends of their watched stocks.
Enhancing "Investment Social" with One-Click Import of Stock Picks
INVESTMENT SOCIAL
With the rise of investment socializing, stock recommendations play a key role. Instead of manually entering stock codes from curated lists, a one-click import would save time, allowing users to focus on research and analysis.
Recently-Added Stock Filtering
DATA FILTERING AND GROUPING
For short-term traders, newly added stocks are often time-sensitive. To make it easier to revisit them, I added a “Watchlist” tab under the existing “Recently Viewed” section in moomoo.
NOW
THEN
Add an “All” Option
DATA FILTERING AND GROUPING
In testing, I found that none of the users intuitively understood that clicking a selected market would deselect it. To address this, I introduced an explicit “All” option, making it easier for users to reset their selection without guesswork.
NOW
THEN
Stock Notes: Stay on Track
SINGLE STOCK ENQUIRY
Traders often observe market conditions throughout the day (e.g., breakouts, end-of-day) before making a decision. Quick notes help users track and reduce errors. Using natural language processing can make the interaction more intuitive.
moomoo
Tesla: Sell if pullback
3:30
Provide Diverse Data and Customisable Data Combinations
SINGLE STOCK ENQUIRY
Users evaluate individual stocks from various dimensions. With more space in watchlist page, users can build their personalised data combinations.
Market Cap
Consecutive Up Days
MTD Chg
Flexible Candlestick Chart Viewing
QUICK OVERVIEW
The human brain processes visual patterns faster than numerical analysis, making candlestick charts key for quickly grasping trends. In the watchlist, allowing users to select timeframes (e.g., monthly, weekly) while viewing price charts helps investors spot trends faster. The candlestick chart in the stock info panel further enhances efficiency by enabling quick comparisons across timeframes.
Chart View (Adopting Mobile Functionality)
QUICK OVERVIEW
Similarly, leveraging the larger screen on the desktop, the icon view helps users quickly grasp the market trends of their watched stocks.
Enhancing "Investment Social" with One-Click Import of Stock Picks
INVESTMENT SOCIAL
With the rise of investment socializing, stock recommendations play a key role. Instead of manually entering stock codes from curated lists, a one-click import would save time, allowing users to focus on research and analysis.